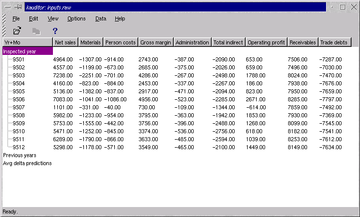
Main window
Displays the loaded analysis data, and predictions from some methods.
|  |
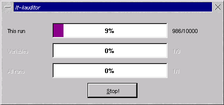
Training progress dialog
Training the neural network prediction method can sometimes
take quite a lot of time, even hours with really big networks.
|  |
Plot dialog
This is the most interesting window in KAuditor: a
visualization tool for the analysis of the prediction results
from different methods. It's the user's problem to understand
what the curves mean, the program makes it as easy as
possible. Uses Gnuplot as the interactive display, and
supports output to EPS and GIF.
|  |
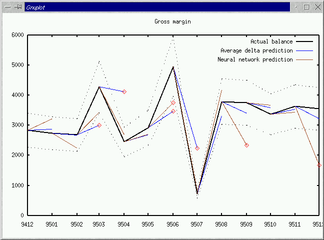
Gnuplot window
The prediction results are shown as curves. The program draws
also error boundary lines of given width.
|  |
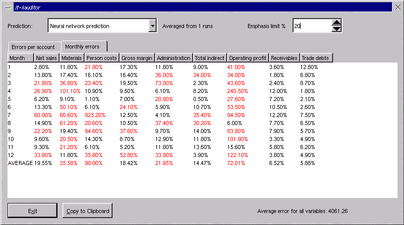
Prediction statistics dialog
Displays prediction errors for each month and each variable (account).
|  |
Neural network options
Controls various training options of the neural network
prediction method.
|  |
