 Web Server Statistics for NIC.Funet.fi Web Server Statistics for NIC.Funet.fi
(Go To: Top: General Summary: Monthly Report: Daily Summary: Hourly Summary: Domain Report: Organisation Report: Status Code Report: File Size Report: File Type Report: Directory Report: Request Report)
This report contains overall statistics.
Successful requests: 103
Average successful requests per day: 15
Distinct files requested: 40
Distinct hosts served: 47
Data transferred: 323.34 megabytes
Average data transferred per day: 49.50 megabytes
(Go To: Top: General Summary: Monthly Report: Daily Summary: Hourly Summary: Domain Report: Organisation Report: Status Code Report: File Size Report: File Type Report: Directory Report: Request Report)
This report lists the activity in each month.
Each unit ( ) represents 15 megabytes
or part thereof.
) represents 15 megabytes
or part thereof.
   month: Mbytes: %bytes: reqs:  %reqs:
--------: ------: ------: ----: ------:
Dec 2003: 323.34:   100%:  103:   100%:
Busiest month: Dec 2003 (323.34 megabytes).
(Go To: Top: General Summary: Monthly Report: Daily Summary: Hourly Summary: Domain Report: Organisation Report: Status Code Report: File Size Report: File Type Report: Directory Report: Request Report)
This report lists the total activity for each day of the week, summed over all the weeks in the report.
Each unit () represents 4 megabytes
or part thereof.
day: Mbytes: %bytes: reqs: %reqs: ---: ------: ------: ----: ------: Sun: 39.80: 12.31%: 16: 15.53%:Wed: 0.86: 0.26%: 8: 7.77%:
(Go To: Top: General Summary: Monthly Report: Daily Summary: Hourly Summary: Domain Report: Organisation Report: Status Code Report: File Size Report: File Type Report: Directory Report: Request Report)
This report lists the total activity for each hour of the day, summed over all the days in the report.
Each unit () represents 1 request
for a page.
hour: Mbytes: %bytes: reqs:  %reqs:
----: ------: ------: ----: ------:
   0:  31.09:  9.62%:    9:  8.74%:
   1:   2.45:  0.76%:    4:  3.88%:
   2:   0.00:       :    0:       :
   3:   0.00:       :    0:       :
   4:   0.00:       :    0:       :
   5:   6.60:  2.04%:    3:  2.91%:
   6:  22.83:  7.06%:    3:  2.91%:
   7:  22.52:  6.96%:    1:  0.97%:
   8:   0.00:       :    0:       :
   9:   0.00:       :    1:  0.97%:
  10:   0.00:       :    0:       :
  11:  11.49:  3.56%:    5:  4.85%:
  12:   0.00:       :    0:       :
  13:   0.22:  0.07%:    2:  1.94%:
  14:  98.00: 30.31%:    7:  6.80%:
  15:  27.55:  8.52%:    4:  3.88%:
  16:  34.65: 10.72%:    6:  5.83%:
  17:  19.47:  6.02%:    8:  7.77%:
  18:   0.21:  0.07%:    6:  5.83%:
  19:  20.71:  6.40%:   10:  9.71%:
  20:   0.78:  0.24%:    1:  0.97%:
  21:  21.29:  6.58%:    4:  3.88%:
  22:   3.24:  1.00%:   26: 25.24%:
  23:   0.25:  0.08%:    3:  2.91%:
(Go To: Top: General Summary: Monthly Report: Daily Summary: Hourly Summary: Domain Report: Organisation Report: Status Code Report: File Size Report: File Type Report: Directory Report: Request Report)
This report lists the countries of the computers which requested files.
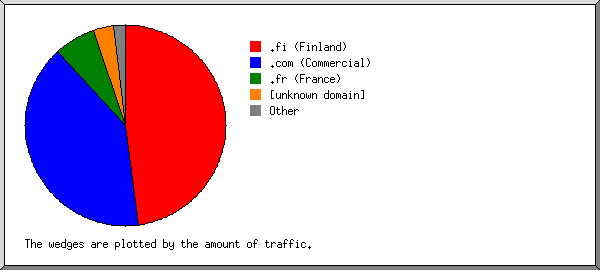
Listing domains, sorted by the amount of traffic.
Mbytes: %bytes: reqs:  %reqs: domain
------: ------: ----: ------: ------
176.62: 54.62%:   42: 40.78%: .fi (Finland)
 57.16: 17.68%:    3:  2.91%:   netsonic.fi
 45.50: 14.07%:    5:  4.85%:   siba.fi
 29.27:  9.05%:    8:  7.77%:   soneraliving.fi
 29.27:  9.05%:    1:  0.97%:   inet.fi
 15.24:  4.71%:    2:  1.94%:   dnainternet.fi
 28.48:  8.81%:    2:  1.94%: .lt (Lithuania)
 27.49:  8.50%:    1:  0.97%: .de (Germany)
 20.71:  6.40%:    9:  8.74%: .ro (Romania)
 14.31:  4.43%:    1:  0.97%: .it (Italy)
 10.99:  3.40%:   18: 17.48%: [unknown domain]
  7.50:  2.32%:    1:  0.97%: .in (India)
  6.74:  2.08%:    4:  3.88%: .fr (France)
  6.60:  2.04%:    3:  2.91%: .au (Australia)
  6.47:  2.00%:    1:  0.97%: .ar (Argentina)
  6.11:  1.89%:    2:  1.94%: .ru (Russia)
  4.82:  1.49%:    3:  2.91%: .com (Commercial)
  2.87:  0.89%:    1:  0.97%:   rogers.com
  1.82:  0.56%:    1:  0.97%:   charter.com
  3.35:  1.04%:    4:  3.88%: .br (Brazil)
  2.78:  0.86%:    9:  8.74%: .net (Networks)
  1.77:  0.55%:    1:  0.97%:   earthlink.net
  0.38:  0.12%:    3:  2.91%: .ch (Switzerland)
(Go To: Top: General Summary: Monthly Report: Daily Summary: Hourly Summary: Domain Report: Organisation Report: Status Code Report: File Size Report: File Type Report: Directory Report: Request Report)
This report lists the organisations of the computers which requested files.
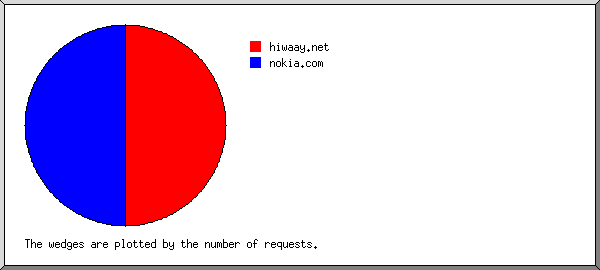
Listing the top 20 organisations by the number of requests, sorted by the number of requests.
reqs: %bytes: organisation
----: ------: ------------
  19:  0.03%: htv.fi
  18:  3.40%: [unknown domain]
   9:  6.40%: zappmobile.ro
   8:  9.05%: soneraliving.fi
   5:  0.04%: bellsouth.net
   5: 14.07%: siba.fi
   4:  0.03%: mtv3.fi
   3: 17.68%: netsonic.fi
   3:  0.02%: noos.fr
   3:  2.04%: netspace.net.au
   2:  8.81%: b4net.lt
   2:  4.71%: dnainternet.fi
   2:  0.05%: hispeed.ch
   2:  0.88%: ig.com.br
   1:  1.71%: quantum.ru
   1:  8.50%: mopower.de
   1:  2.32%: now-india.net.in
   1:  0.16%: telemar.net.br
   1:  0.18%: sovintel.ru
   1:  9.05%: inet.fi
  12: 10.87%: [not listed: 12 organisations]
(Go To: Top: General Summary: Monthly Report: Daily Summary: Hourly Summary: Domain Report: Organisation Report: Status Code Report: File Size Report: File Type Report: Directory Report: Request Report)
This report lists the HTTP status codes of all requests.
Listing status codes, sorted numerically.
reqs: status code
----: -----------
 103: 200 OK
(Go To: Top: General Summary: Monthly Report: Daily Summary: Hourly Summary: Domain Report: Organisation Report: Status Code Report: File Size Report: File Type Report: Directory Report: Request Report)
This report lists the sizes of files.

       size: reqs: %bytes:
-----------: ----: ------:
          0:   17:       :
   1B-  10B:    0:       :
  11B- 100B:    6:       :
 101B-  1kB:   14:       :
  1kB- 10kB:   12:  0.01%:
 10kB-100kB:   21:  0.34%:
100kB-  1MB:    8:  0.98%:
  1MB- 10MB:   12: 15.97%:
 10MB-100MB:   13: 82.70%:
(Go To: Top: General Summary: Monthly Report: Daily Summary: Hourly Summary: Domain Report: Organisation Report: Status Code Report: File Size Report: File Type Report: Directory Report: Request Report)
This report lists the extensions of files.
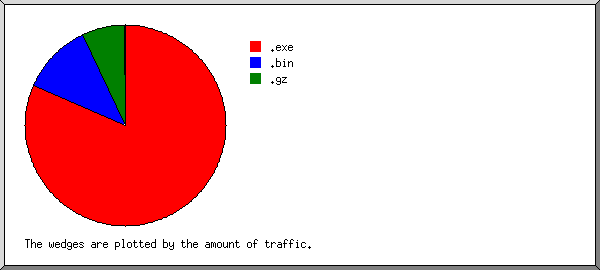
Listing extensions with at least 0.1% of the traffic, sorted by the amount of traffic.
Mbytes: %bytes: reqs:  %reqs: extension
------: ------: ----: ------: ---------
321.46: 99.42%:   61: 59.22%: .exe
  1.77:  0.55%:    1:  0.97%: .bin
  0.11:  0.04%:   41: 39.81%: [not listed: 4 extensions]
(Go To: Top: General Summary: Monthly Report: Daily Summary: Hourly Summary: Domain Report: Organisation Report: Status Code Report: File Size Report: File Type Report: Directory Report: Request Report)
This report lists the directories from which files were requested. (The figures for each directory include all of its subdirectories.)
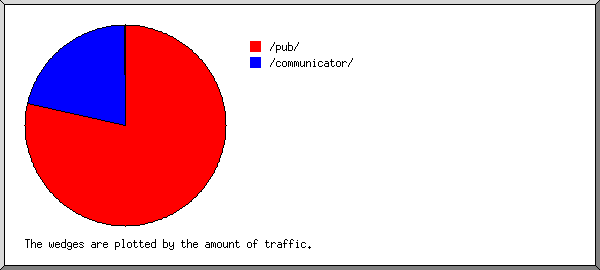
Listing directories with at least 0.01% of the traffic, sorted by the amount of traffic.
Mbytes: %bytes: reqs:  %reqs: pages: %pages: directory
------: ------: ----: ------: -----: ------: ---------
255.23: 78.93%:   82: 79.61%:     0:       : /pub/
 68.10: 21.06%:    5:  4.85%:     0:       : /communicator/
  0.01:       :   16: 15.53%:     0:       : [not listed: 2 directories]
(Go To: Top: General Summary: Monthly Report: Daily Summary: Hourly Summary: Domain Report: Organisation Report: Status Code Report: File Size Report: File Type Report: Directory Report: Request Report)
This report lists the files on the site.
Listing files with at least 20 requests, sorted by the number of requests.
Mbytes: %bytes: reqs:  %reqs: file
------: ------: ----: ------: ----
323.34:   100%:  103:   100%: [not listed: 40 files]
(Go To: Top: General Summary: Monthly Report: Daily Summary: Hourly Summary: Domain Report: Organisation Report: Status Code Report: File Size Report: File Type Report: Directory Report: Request Report)


