 Web Server Statistics for NIC.Funet.fi Web Server Statistics for NIC.Funet.fi
(Go To: Top: General Summary: Monthly Report: Daily Summary: Hourly Summary: Domain Report: Organisation Report: Status Code Report: File Size Report: File Type Report: Directory Report: Request Report)
This report contains overall statistics.
Successful requests: 85
Average successful requests per day: 14
Successful requests for pages: 1
Distinct files requested: 41
Distinct hosts served: 33
Data transferred: 196.721 megabytes
Average data transferred per day: 33.464 megabytes
(Go To: Top: General Summary: Monthly Report: Daily Summary: Hourly Summary: Domain Report: Organisation Report: Status Code Report: File Size Report: File Type Report: Directory Report: Request Report)
This report lists the activity in each month.
Each unit ( ) represents 10 megabytes
or part thereof.
) represents 10 megabytes
or part thereof.
   month:  Mbytes: %bytes: reqs:  %reqs:
--------: -------: ------: ----: ------:
Jul 2003: 196.721:   100%:   85:   100%:
Busiest month: Jul 2003 (196.721 megabytes).
(Go To: Top: General Summary: Monthly Report: Daily Summary: Hourly Summary: Domain Report: Organisation Report: Status Code Report: File Size Report: File Type Report: Directory Report: Request Report)
This report lists the total activity for each day of the week, summed over all the weeks in the report.
Each unit () represents 2.5 megabytes
or part thereof.
day: Mbytes: %bytes: reqs: %reqs: ---: -------: ------: ----: ------: Sun: 26.480: 13.46%: 8: 9.41%:Tue: 0.507: 0.26%: 2: 2.35%:
Fri: 36.311: 18.46%: 26: 30.59%:
(Go To: Top: General Summary: Monthly Report: Daily Summary: Hourly Summary: Domain Report: Organisation Report: Status Code Report: File Size Report: File Type Report: Directory Report: Request Report)
This report lists the total activity for each hour of the day, summed over all the days in the report.
Each unit () represents 1 request
for a page.
hour: Mbytes: %bytes: reqs: %reqs: ----: -------: ------: ----: ------: 0: 0.000: : 0: : 1: 19.783: 10.06%: 8: 9.41%: 2: 0.000: : 0: : 3: 0.046: 0.02%: 3: 3.53%: 4: 0.340: 0.17%: 4: 4.71%: 5: 0.000: : 0: : 6: 0.000: : 0: : 7: 0.000: : 0: : 8: 0.698: 0.36%: 1: 1.18%: 9: 0.000: : 0: : 10: 29.670: 15.08%: 2: 2.35%: 11: 3.101: 1.58%: 2: 2.35%: 12: 57.046: 29.00%: 12: 14.12%: 13: 6.129: 3.12%: 2: 2.35%: 14: 21.951: 11.16%: 3: 3.53%:
(Go To: Top: General Summary: Monthly Report: Daily Summary: Hourly Summary: Domain Report: Organisation Report: Status Code Report: File Size Report: File Type Report: Directory Report: Request Report)
This report lists the countries of the computers which requested files.
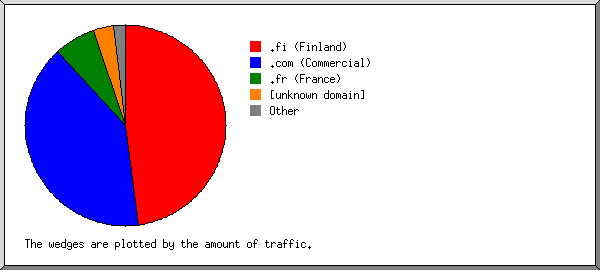
Listing domains, sorted by the amount of traffic.
 Mbytes: %bytes: reqs:  %reqs: domain
-------: ------: ----: ------: ------
 80.361: 40.85%:   21: 24.71%: .fi (Finland)
 29.277: 14.88%:   10: 11.76%:   htv.fi
 22.752: 11.57%:    8:  9.41%:   siba.fi
 16.430:  8.35%:    1:  1.18%:   uwasa.fi
 11.901:  6.05%:    1:  1.18%:   kelloseppakoulu.fi
 42.452: 21.58%:   10: 11.76%: .com (Commercial)
 21.581: 10.97%:    4:  4.71%:   wlannet.com
 17.316:  8.80%:    1:  1.18%:   valimo.com
  2.710:  1.38%:    1:  1.18%:   rogers.com
 33.802: 17.18%:    7:  8.24%: [unknown domain]
 11.960:  6.08%:    5:  5.88%: .fr (France)
 11.153:  5.67%:    3:  3.53%: .br (Brazil)
 10.764:  5.47%:    4:  4.71%: .jp (Japan)
  5.931:  3.02%:    9: 10.59%: .net (Networks)
  5.489:  2.79%:    1:  1.18%:   ewetel.net
  0.187:  0.10%:   12: 14.12%: .lt (Lithuania)
  0.054:  0.03%:    1:  1.18%: .il (Israel)
  0.046:  0.02%:    1:  1.18%: .dk (Denmark)
  0.005:       :   12: 14.12%: .ro (Romania)
(Go To: Top: General Summary: Monthly Report: Daily Summary: Hourly Summary: Domain Report: Organisation Report: Status Code Report: File Size Report: File Type Report: Directory Report: Request Report)
This report lists the organisations of the computers which requested files.

Listing the top 20 organisations by the number of requests, sorted by the number of requests.
reqs: %bytes: organisation
----: ------: ------------
  12:  0.10%: takas.lt
  11:       : zappmobile.ro
  10: 14.88%: htv.fi
   8: 11.57%: siba.fi
   7: 17.18%: [unknown domain]
   4: 10.97%: wlannet.com
   4:  0.43%: aol.com
   4:  0.05%: epix.net
   4:  5.47%: gol.ne.jp
   4:  0.17%: prtc.net
   2:  0.07%: wanadoo.fr
   2:  2.08%: tiscali.fr
   2:  1.27%: cpts.pucrs.br
   1:  3.92%: club-internet.fr
   1:  4.40%: prodepa.gov.br
   1:  0.02%: webspeed.dk
   1:  0.03%: aquanet.co.il
   1:  8.80%: valimo.com
   1:       : surfeu.fi
   1:  2.79%: ewetel.net
   4: 15.78%: [not listed: 4 organisations]
(Go To: Top: General Summary: Monthly Report: Daily Summary: Hourly Summary: Domain Report: Organisation Report: Status Code Report: File Size Report: File Type Report: Directory Report: Request Report)
This report lists the HTTP status codes of all requests.
Listing status codes, sorted numerically.
reqs: status code
----: -----------
  85: 200 OK
(Go To: Top: General Summary: Monthly Report: Daily Summary: Hourly Summary: Domain Report: Organisation Report: Status Code Report: File Size Report: File Type Report: Directory Report: Request Report)
This report lists the sizes of files.

       size: reqs: %bytes:
-----------: ----: ------:
          0:    7:       :
   1b-  10b:    0:       :
  11b- 100b:    5:       :
 101b-  1kb:   11:       :
  1kb- 10kb:    8:  0.01%:
 10kb-100kb:   24:  0.40%:
100kb-  1Mb:   10:  1.32%:
  1Mb- 10Mb:   13: 26.12%:
 10Mb-100Mb:    7: 72.15%:
(Go To: Top: General Summary: Monthly Report: Daily Summary: Hourly Summary: Domain Report: Organisation Report: Status Code Report: File Size Report: File Type Report: Directory Report: Request Report)
This report lists the extensions of requested files.
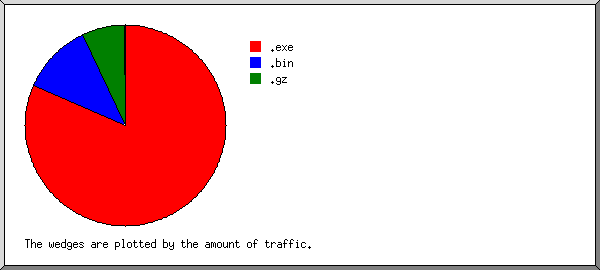
Listing extensions with at least 0.1% of the traffic, sorted by the amount of traffic.
 Mbytes: %bytes: reqs:  %reqs: extension
-------: ------: ----: ------: ---------
133.712: 67.97%:   38: 44.71%: .exe  [Executables]
 52.039: 26.45%:    3:  3.53%: .gz   [Gzip compressed files]
 52.039: 26.45%:    3:  3.53%:   .tar.gz [Compressed archives]
 10.918:  5.55%:   14: 16.47%: .ZIP
  0.050:  0.03%:   30: 35.29%: [not listed: 6 extensions]
(Go To: Top: General Summary: Monthly Report: Daily Summary: Hourly Summary: Domain Report: Organisation Report: Status Code Report: File Size Report: File Type Report: Directory Report: Request Report)
This report lists the directories from which files were requested. (The figures for each directory include all of its subdirectories.)
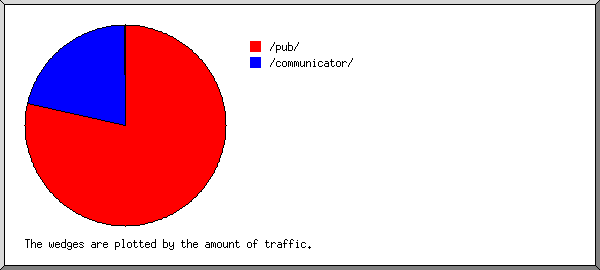
Listing directories with at least 0.01% of the traffic, sorted by the amount of traffic.
 Mbytes: %bytes: reqs:  %reqs: pages: %pages: directory
-------: ------: ----: ------: -----: ------: ---------
135.065: 68.66%:   66: 77.65%:     1:   100%: /pub/
 61.649: 31.34%:   11: 12.94%:     0:       : /communicator/
  0.006:       :    8:  9.41%:     0:       : [not listed: 2 directories]
(Go To: Top: General Summary: Monthly Report: Daily Summary: Hourly Summary: Domain Report: Organisation Report: Status Code Report: File Size Report: File Type Report: Directory Report: Request Report)
This report lists the files on the site.
Listing files with at least 20 requests, sorted by the number of requests.
 Mbytes: %bytes: reqs:  %reqs: file
-------: ------: ----: ------: ----
196.721:   100%:   85:   100%: [not listed: 41 files]
(Go To: Top: General Summary: Monthly Report: Daily Summary: Hourly Summary: Domain Report: Organisation Report: Status Code Report: File Size Report: File Type Report: Directory Report: Request Report)

