 Web Server Statistics for NIC.Funet.fi
 Web Server Statistics for NIC.Funet.fi
(Go To: Top: General Summary: Monthly Report: Daily Summary: Hourly Summary: Domain Report: Organisation Report: Status Code Report: File Size Report: File Type Report: Directory Report: Request Report)
This report contains overall statistics.
Successful requests: 1,228
Average successful requests per day: 175
Distinct files requested: 70
Distinct hosts served: 662
Data transferred: 1.670 gigabytes
Average data transferred per day: 244.465 megabytes
(Go To: Top: General Summary: Monthly Report: Daily Summary: Hourly Summary: Domain Report: Organisation Report: Status Code Report: File Size Report: File Type Report: Directory Report: Request Report)
This report lists the activity in each month.
Each unit ( ) represents 0.08 gigabytes
or part thereof.
   month:  Gbytes: %bytes: reqs:  %reqs:
--------: -------: ------: ----: ------:
Mar 2003:   1.670:   100%: 1228:   100%:
Busiest month: Mar 2003 (1.670 gigabytes).
(Go To: Top: General Summary: Monthly Report: Daily Summary: Hourly Summary: Domain Report: Organisation Report: Status Code Report: File Size Report: File Type Report: Directory Report: Request Report)
This report lists the total activity for each day of the week, summed over all the weeks in the report.
Each unit ( ) represents 15 megabytes
or part thereof.
day: Mbytes: %bytes: reqs: %reqs: ---: -------: ------: ----: ------: Sun: 312.985: 18.29%: 201: 16.37%:Mon: 187.962: 10.98%: 165: 13.44%:
Tue: 132.025: 7.72%: 158: 12.87%:
Wed: 332.484: 19.43%: 139: 11.32%:
Thu: 386.916: 22.61%: 214: 17.43%:
Fri: 154.682: 9.04%: 196: 15.96%:
Sat: 204.032: 11.92%: 155: 12.62%:

(Go To: Top: General Summary: Monthly Report: Daily Summary: Hourly Summary: Domain Report: Organisation Report: Status Code Report: File Size Report: File Type Report: Directory Report: Request Report)
This report lists the total activity for each hour of the day, summed over all the days in the report.
Each unit ( ) represents 1 request
for a page.
hour:  Mbytes: %bytes: reqs:  %reqs:
----: -------: ------: ----: ------:
   0:  21.443:  1.25%:   58:  4.72%:
   1:  21.691:  1.27%:   67:  5.46%:
   2:  39.663:  2.32%:   53:  4.32%:
   3:  15.165:  0.89%:   36:  2.93%:
   4:  18.190:  1.06%:   51:  4.15%:
   5:   5.079:  0.30%:   30:  2.44%:
   6:  36.910:  2.16%:   49:  3.99%:
   7:  20.463:  1.20%:   39:  3.18%:
   8:  31.776:  1.86%:   25:  2.04%:
   9: 103.499:  6.05%:   33:  2.69%:
  10:  83.579:  4.88%:   44:  3.58%:
  11: 105.108:  6.14%:   30:  2.44%:
  12:  37.440:  2.19%:   31:  2.52%:
  13:  60.597:  3.54%:   39:  3.18%:
  14:  93.270:  5.45%:   50:  4.07%:
  15:  87.269:  5.10%:   68:  5.54%:
  16:  19.658:  1.15%:   57:  4.64%:
  17: 183.426: 10.72%:   65:  5.29%:
  18: 103.860:  6.07%:   45:  3.66%:
  19:  53.089:  3.10%:   75:  6.11%:
  20:  93.104:  5.44%:   59:  4.80%:
  21: 208.466: 12.18%:   74:  6.03%:
  22:  48.983:  2.86%:   88:  7.17%:
  23: 219.352: 12.82%:   62:  5.05%:
(Go To: Top: General Summary: Monthly Report: Daily Summary: Hourly Summary: Domain Report: Organisation Report: Status Code Report: File Size Report: File Type Report: Directory Report: Request Report)
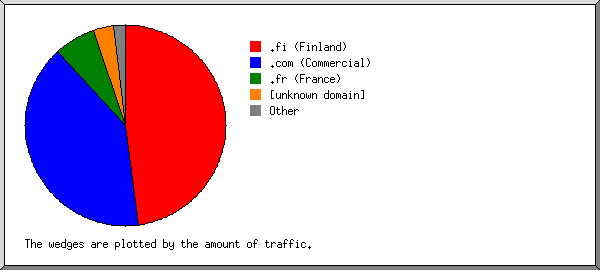
This report lists the countries of the computers which requested files.

Listing domains, sorted by the amount of traffic.
 Mbytes: %bytes: reqs:  %reqs: domain
-------: ------: ----: ------: ------
730.476: 42.69%:   53:  4.32%: .fi (Finland)
428.614: 25.05%:   20:  1.63%:   tpo.fi
 45.142:  2.64%:    2:  0.16%:   htv.fi
 42.354:  2.48%:    5:  0.41%:   inet.fi
 32.298:  1.89%:   11:  0.90%:   utu.fi
 31.352:  1.83%:    1:  0.08%:   kolumbus.fi
 31.352:  1.83%:    1:  0.08%:   hepunet.fi
 31.352:  1.83%:    1:  0.08%:   fmi.fi
 22.747:  1.33%:    1:  0.08%:   sonera.fi
 22.404:  1.31%:    1:  0.08%:   jakobstad.fi
 16.693:  0.98%:    1:  0.08%:   ksp.fi
 14.159:  0.83%:    1:  0.08%:   kase.fi
 11.928:  0.70%:    1:  0.08%:   uusikaupunki.fi
199.068: 11.63%:  276: 22.48%: [unknown domain]
198.927: 11.63%:  123: 10.02%: .br (Brazil)
129.834:  7.59%:   64:  5.21%: .fr (France)
122.352:  7.15%:  166: 13.52%: .net (Networks)
 34.318:  2.01%:   36:  2.93%:   proxad.net
 34.120:  1.99%:    8:  0.65%:   t-dialin.net
 17.182:  1.00%:    1:  0.08%:   arcor-ip.net
 16.712:  0.98%:    1:  0.08%:   suomi.net
 68.380:  4.00%:  134: 10.91%: .ca (Canada)
 60.957:  3.56%:   74:  6.03%: .com (Commercial)
 43.620:  2.55%:   34:  2.77%:   aol.com
 34.106:  1.99%:   18:  1.47%: .ch (Switzerland)
 31.031:  1.81%:    5:  0.41%: .de (Germany)
 22.406:  1.31%:   29:  2.36%: .ro (Romania)
 20.819:  1.22%:   14:  1.14%: .be (Belgium)
 18.989:  1.11%:    2:  0.16%: .jp (Japan)
 16.637:  0.97%:   41:  3.34%: .mx (Mexico)
  9.442:  0.55%:    5:  0.41%: .at (Austria)
  9.433:  0.55%:    8:  0.65%: .co (Colombia)
  6.103:  0.36%:   10:  0.81%: .sg (Singapore)
  4.786:  0.28%:    2:  0.16%: .nl (Netherlands)
  4.614:  0.27%:   16:  1.30%: .nz (New Zealand)
  3.478:  0.20%:   17:  1.38%: .ar (Argentina)
  3.381:  0.20%:   40:  3.26%: .au (Australia)
  3.255:  0.19%:    7:  0.57%: .my (Malaysia)
  1.864:  0.11%:    9:  0.73%: .tr (Turkey)
  1.638:  0.10%:   12:  0.98%: .cz (Czech Republic)
  1.141:  0.07%:    5:  0.41%: .th (Thailand)
  1.140:  0.07%:    6:  0.49%: .ee (Estonia)
  1.042:  0.06%:    9:  0.73%: .yu (Yugoslavia)
  0.651:  0.04%:   14:  1.14%: .dk (Denmark)
  0.634:  0.04%:   10:  0.81%: .es (Spain)
  0.541:  0.03%:    4:  0.33%: .sa (Saudi Arabia)
  0.447:  0.03%:    6:  0.49%: .in (India)
  0.414:  0.02%:    4:  0.33%: .do (Dominican Republic)
  0.405:  0.02%:    5:  0.41%: .uk (United Kingdom)
  0.335:  0.02%:    3:  0.24%: .hu (Hungary)
  0.242:  0.01%:    3:  0.24%: .bg (Bulgaria)
  0.242:  0.01%:    8:  0.65%: .gt (Guatemala)
  0.234:  0.01%:    1:  0.08%: .cy (Cyprus)
  0.203:  0.01%:    4:  0.33%: .lt (Lithuania)
  0.197:  0.01%:    2:  0.16%: .pt (Portugal)
  0.176:  0.01%:    2:  0.16%: .mu (Mauritius)
  0.171:  0.01%:    2:  0.16%: .hr (Croatia)
  0.138:  0.01%:    2:  0.16%: .ie (Ireland)
  0.137:  0.01%:    2:  0.16%: .pk (Pakistan)
  0.137:  0.01%:    2:  0.16%: .cr (Costa Rica)
  0.131:  0.01%:    2:  0.16%: .tt (Trinidad and Tobago)
  0.117:  0.01%:    1:  0.08%: .it (Italy)
  0.097:  0.01%:    2:  0.16%: .ph (Philippines)
  0.078:       :    1:  0.08%: .za (South Africa)
  0.039:       :    1:  0.08%: [unresolved numerical addresses]
  0.000:       :    2:  0.16%: .lu (Luxembourg)
(Go To: Top: General Summary: Monthly Report: Daily Summary: Hourly Summary: Domain Report: Organisation Report: Status Code Report: File Size Report: File Type Report: Directory Report: Request Report)
This report lists the organisations of the computers which requested files.

Listing the top 20 organisations by the number of requests, sorted by the number of requests.
reqs: %bytes: organisation
----: ------: ------------
 277: 11.64%: [unknown domain]
  46:  2.88%: wanadoo.fr
  44:  0.36%: sympatico.ca
  36:  2.01%: proxad.net
  34:  2.55%: aol.com
  31:  0.09%: cantv.net
  28:  1.22%: mc.videotron.ca
  25:  1.11%: qc.sympatico.ca
  22:  0.36%: prodigy.net.mx
  20: 25.05%: tpo.fi
  18:  3.25%: telesp.net.br
  16:  0.90%: ig.com.br
  12:  0.99%: adsl.skynet.be
  11:  1.89%: utu.fi
  10:  0.25%: xtra.co.nz
  10:  1.83%: brasiltelecom.net.br
  10:  0.02%: tele.dk
   9:  0.06%: netvigator.com
   9:  0.94%: veloxzone.com.br
   9:  0.55%: megared.net.mx
 551: 42.06%: [not listed: 226 organisations]
(Go To: Top: General Summary: Monthly Report: Daily Summary: Hourly Summary: Domain Report: Organisation Report: Status Code Report: File Size Report: File Type Report: Directory Report: Request Report)
This report lists the HTTP status codes of all requests.
Listing status codes, sorted numerically.
reqs: status code
----: -----------
1228: 200 OK
(Go To: Top: General Summary: Monthly Report: Daily Summary: Hourly Summary: Domain Report: Organisation Report: Status Code Report: File Size Report: File Type Report: Directory Report: Request Report)
This report lists the sizes of files.

       size: reqs: %bytes:
-----------: ----: ------:
          0:   48:       :
   1b-  10b:    0:       :
  11b- 100b:    1:       :
 101b-  1kb:    4:       :
  1kb- 10kb:    8:       :
 10kb-100kb:  652:  2.37%:
100kb-  1Mb:  329:  4.41%:
  1Mb- 10Mb:  145: 40.17%:
 10Mb-100Mb:   41: 53.04%:
(Go To: Top: General Summary: Monthly Report: Daily Summary: Hourly Summary: Domain Report: Organisation Report: Status Code Report: File Size Report: File Type Report: Directory Report: Request Report)
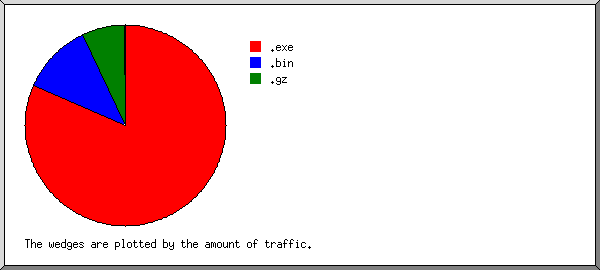
This report lists the extensions of requested files.

Listing extensions with at least 0.1% of the traffic, sorted by the amount of traffic.
 Gbytes: %bytes: reqs:  %reqs: extension
-------: ------: ----: ------: ---------
  1.384: 82.88%: 1176: 95.77%: .exe  [Executables]
  0.266: 15.95%:   22:  1.79%: .gz   [Gzip compressed files]
  0.266: 15.95%:   22:  1.79%:   .tar.gz [Compressed archives]
  0.013:  0.83%:    1:  0.08%: .xpi
  0.003:  0.20%:    6:  0.49%: .zip  [Zip archives]
  0.001:  0.11%:    3:  0.24%: .bin
  0.000:  0.03%:   20:  1.63%: [not listed: 5 extensions]
(Go To: Top: General Summary: Monthly Report: Daily Summary: Hourly Summary: Domain Report: Organisation Report: Status Code Report: File Size Report: File Type Report: Directory Report: Request Report)
This report lists the directories from which files were requested. (The figures for each directory include all of its subdirectories.)

Listing directories with at least 0.01% of the traffic, sorted by the amount of traffic.
 Gbytes: %bytes: reqs:  %reqs: pages: %pages: directory
-------: ------: ----: ------: -----: ------: ---------
  1.607: 96.19%: 1214: 98.86%:     0:       : /pub/
  0.063:  3.80%:    4:  0.33%:     0:       : /communicator/
  0.000:       :   10:  0.81%:     0:       : [not listed: 2 directories]
(Go To: Top: General Summary: Monthly Report: Daily Summary: Hourly Summary: Domain Report: Organisation Report: Status Code Report: File Size Report: File Type Report: Directory Report: Request Report)
This report lists the files on the site.

Listing files with at least 20 requests, sorted by the number of requests.
 Gbytes: %bytes: reqs:  %reqs: file
-------: ------: ----: ------: ----
  0.048:  2.89%:  626: 50.98%: /pub/netscape7/english/7.0/windows/win32/NSSetup.exe
  0.189: 11.33%:   89:  7.25%: /pub/netscape7/portuguese_br/7.0/windows/win32/sea/NSSetupB.exe
  0.004:  0.29%:   58:  4.72%: /pub/netscape7/spanish/7.0/windows/win32/NSSetup.exe
  0.251: 15.04%:   50:  4.07%: /pub/netscape7/french/7.0/windows/win32/sea/NSSetupB.exe
  0.003:  0.21%:   38:  3.09%: /pub/netscape7/german/7.0/windows/win32/NSSetup.exe
  0.002:  0.13%:   31:  2.52%: /pub/netscape7/english_uk/7.0/windows/win32/NSSetup.exe
  0.002:  0.16%:   30:  2.44%: /pub/netscape7/french/7.0/windows/win32/NSSetup.exe
  0.002:  0.13%:   29:  2.36%: /pub/netscape7/german/7.01/windows/win32/NSSetup.exe
  0.001:  0.10%:   22:  1.79%: /pub/netscape7/french/7.01/windows/win32/NSSetup.exe
  0.116:  6.95%:   20:  1.63%: /pub/netscape7/german/7.01/windows/win32/sea/NSSetupB.exe
  1.048: 62.76%:  235: 19.14%: [not listed: 60 files]
(Go To: Top: General Summary: Monthly Report: Daily Summary: Hourly Summary: Domain Report: Organisation Report: Status Code Report: File Size Report: File Type Report: Directory Report: Request Report)