 Web Server Statistics for NIC.Funet.fi
 Web Server Statistics for NIC.Funet.fi
(Go To: Top: General Summary: Monthly Report: Daily Summary: Hourly Summary: Domain Report: Organisation Report: Status Code Report: File Size Report: File Type Report: Directory Report: Request Report)
This report contains overall statistics.
Successful requests: 349
Average successful requests per day: 58
Distinct files requested: 143
Distinct hosts served: 119
Data transferred: 1.242 gigabytes
Average data transferred per day: 214.891 megabytes
(Go To: Top: General Summary: Monthly Report: Daily Summary: Hourly Summary: Domain Report: Organisation Report: Status Code Report: File Size Report: File Type Report: Directory Report: Request Report)
This report lists the activity in each month.
Each unit ( ) represents 0.06 gigabytes
or part thereof.
   month:  Gbytes: %bytes: reqs:  %reqs:
--------: -------: ------: ----: ------:
Oct 2002:   1.242:   100%:  349:   100%:
Busiest month: Oct 2002 (1.242 gigabytes).
(Go To: Top: General Summary: Monthly Report: Daily Summary: Hourly Summary: Domain Report: Organisation Report: Status Code Report: File Size Report: File Type Report: Directory Report: Request Report)
This report lists the total activity for each day of the week, summed over all the weeks in the report.
Each unit ( ) represents 20 megabytes
or part thereof.
day: Mbytes: %bytes: reqs: %reqs: ---: -------: ------: ----: ------: Sun: 537.211: 42.23%: 83: 23.78%:Mon: 0.000: : 0: :
Tue: 205.908: 16.19%: 62: 17.77%:
Wed: 103.935: 8.17%: 16: 4.58%:
Thu: 144.152: 11.33%: 49: 14.04%:
Fri: 193.429: 15.20%: 72: 20.63%:
Sat: 87.547: 6.88%: 67: 19.20%:

(Go To: Top: General Summary: Monthly Report: Daily Summary: Hourly Summary: Domain Report: Organisation Report: Status Code Report: File Size Report: File Type Report: Directory Report: Request Report)
This report lists the total activity for each hour of the day, summed over all the days in the report.
Each unit ( ) represents 1 request
for a page.
hour:  Mbytes: %bytes: reqs:  %reqs:
----: -------: ------: ----: ------:
   0:   2.989:  0.24%:   13:  3.72%:
   1:  26.294:  2.07%:    5:  1.43%:
   2:  11.970:  0.94%:    2:  0.57%:
   3:   6.429:  0.51%:    4:  1.15%:
   4:   3.148:  0.25%:    7:  2.01%:
   5:   0.000:       :    0:       :
   6:  18.719:  1.47%:    8:  2.29%:
   7:  12.872:  1.01%:    9:  2.58%:
   8:  75.315:  5.92%:   33:  9.46%:
   9:  60.248:  4.74%:   13:  3.72%:
  10:  66.992:  5.27%:    5:  1.43%:
  11:  71.678:  5.63%:    8:  2.29%:
  12:  38.704:  3.04%:    6:  1.72%:
  13:  93.110:  7.32%:   45: 12.89%:
  14:   3.243:  0.25%:    7:  2.01%:
  15:  89.980:  7.07%:   25:  7.16%:
  16:  63.132:  4.96%:    7:  2.01%:
  17:  46.246:  3.64%:    5:  1.43%:
  18:   0.000:       :    0:       :
  19:   3.823:  0.30%:   12:  3.44%:
  20:  83.119:  6.53%:   15:  4.30%:
  21: 223.313: 17.55%:   28:  8.02%:
  22: 230.220: 18.10%:   69: 19.77%:
  23:  40.627:  3.19%:   23:  6.59%:
(Go To: Top: General Summary: Monthly Report: Daily Summary: Hourly Summary: Domain Report: Organisation Report: Status Code Report: File Size Report: File Type Report: Directory Report: Request Report)
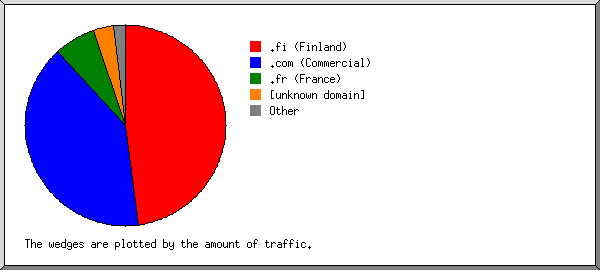
This report lists the countries of the computers which requested files.

Listing domains, sorted by the amount of traffic.
 Mbytes: %bytes: reqs:  %reqs: domain
-------: ------: ----: ------: ------
850.901: 66.89%:  177: 50.72%: .fi (Finland)
366.340: 28.80%:   22:  6.30%:   tpo.fi
107.287:  8.43%:   44: 12.61%:   htv.fi
106.643:  8.38%:   49: 14.04%:   lanwan.fi
 89.894:  7.07%:   15:  4.30%:   inet.fi
 45.495:  3.58%:    2:  0.57%:   naantalispa.fi
 22.766:  1.79%:    3:  0.86%:   utu.fi
 22.755:  1.79%:    2:  0.57%:   siba.fi
 22.749:  1.79%:    2:  0.57%:   hut.fi
 18.400:  1.45%:   19:  5.44%:   weppi.fi
 17.318:  1.36%:    4:  1.15%:   kelloseppakoulu.fi
 16.693:  1.31%:    1:  0.29%:   kpnqwest.fi
 13.312:  1.05%:    4:  1.15%:   omakaista.fi
 83.564:  6.57%:   40: 11.46%: .net (Networks)
 61.150:  4.81%:   28:  8.02%:   raketti.net
  6.460:  0.51%:    1:  0.29%:   varnainter.net
 77.244:  6.07%:    9:  2.58%: .se (Sweden)
 42.339:  3.33%:    5:  1.43%:   bredbandsbolaget.se
 22.747:  1.79%:    1:  0.29%:   folksam.se
 12.157:  0.96%:    3:  0.86%:   liu.se
 68.480:  5.38%:   45: 12.89%: [unknown domain]
 52.235:  4.11%:   17:  4.87%: .com (Commercial)
 31.417:  2.47%:    2:  0.57%:   nokia.com
  9.460:  0.74%:    6:  1.72%:   aol.com
 43.207:  3.40%:    1:  0.29%: .dk (Denmark)
 29.070:  2.29%:   18:  5.16%: .pl (Poland)
 26.838:  2.11%:   10:  2.87%: .fr (France)
  7.375:  0.58%:    5:  1.43%: .tw (Taiwan)
  6.726:  0.53%:    3:  0.86%: .ar (Argentina)
  6.148:  0.48%:    2:  0.57%: .de (Germany)
  5.609:  0.44%:    1:  0.29%: .lt (Lithuania)
  4.414:  0.35%:    7:  2.01%: .tr (Turkey)
  4.203:  0.33%:    4:  1.15%: .br (Brazil)
  2.796:  0.22%:    3:  0.86%: .es (Spain)
  1.968:  0.15%:    2:  0.57%: .ca (Canada)
  1.164:  0.09%:    1:  0.29%: .sg (Singapore)
  0.179:  0.01%:    1:  0.29%: .ro (Romania)
  0.031:       :    1:  0.29%: .mx (Mexico)
  0.023:       :    1:  0.29%: .il (Israel)
  0.000:       :    1:  0.29%: .it (Italy)
(Go To: Top: General Summary: Monthly Report: Daily Summary: Hourly Summary: Domain Report: Organisation Report: Status Code Report: File Size Report: File Type Report: Directory Report: Request Report)
This report lists the organisations of the computers which requested files.

Listing the top 20 organisations by the number of requests, sorted by the number of requests.
reqs: %bytes: organisation
----: ------: ------------
  49:  8.38%: lanwan.fi
  45:  5.38%: [unknown domain]
  44:  8.43%: htv.fi
  28:  4.81%: raketti.net
  22: 28.80%: tpo.fi
  19:  1.45%: weppi.fi
  15:  7.07%: inet.fi
   8:  1.70%: wanadoo.fr
   6:  0.74%: aol.com
   6:  0.32%: ttnet.net.tr
   6:  1.38%: jmc.com.pl
   5:  3.33%: bredbandsbolaget.se
   4:  1.36%: kelloseppakoulu.fi
   4:  0.14%: roltanet.com
   4:  1.05%: omakaista.fi
   4:  0.02%: hel.fi
   3:  0.46%: ethome.net.tw
   3:  0.96%: liu.se
   3:  1.79%: utu.fi
   3:  0.53%: telecom.net.ar
  68: 21.91%: [not listed: 51 organisations]
(Go To: Top: General Summary: Monthly Report: Daily Summary: Hourly Summary: Domain Report: Organisation Report: Status Code Report: File Size Report: File Type Report: Directory Report: Request Report)
This report lists the HTTP status codes of all requests.
Listing status codes, sorted numerically.
reqs: status code
----: -----------
 349: 200 OK
(Go To: Top: General Summary: Monthly Report: Daily Summary: Hourly Summary: Domain Report: Organisation Report: Status Code Report: File Size Report: File Type Report: Directory Report: Request Report)
This report lists the sizes of files.

       size: reqs: %bytes:
-----------: ----: ------:
          0:   16:       :
   1b-  10b:   12:       :
  11b- 100b:   16:       :
 101b-  1kb:   27:       :
  1kb- 10kb:   32:  0.01%:
 10kb-100kb:   60:  0.21%:
100kb-  1Mb:   74:  2.49%:
  1Mb- 10Mb:   74: 18.06%:
 10Mb-100Mb:   38: 79.22%:
(Go To: Top: General Summary: Monthly Report: Daily Summary: Hourly Summary: Domain Report: Organisation Report: Status Code Report: File Size Report: File Type Report: Directory Report: Request Report)
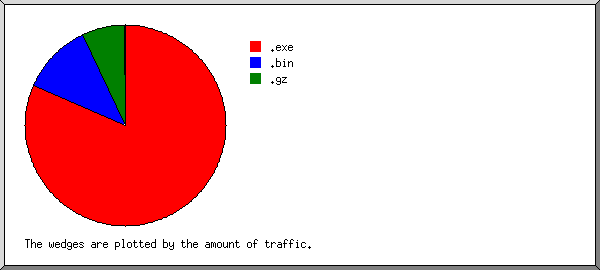
This report lists the extensions of requested files.

Listing extensions with at least 0.1% of the traffic, sorted by the amount of traffic.
 Mbytes: %bytes: reqs:  %reqs: extension
-------: ------: ----: ------: ---------
799.209: 62.82%:  154: 44.13%: .exe  [Executables]
355.380: 27.93%:   37: 10.60%: .gz   [Gzip compressed files]
355.380: 27.93%:   37: 10.60%:   .tar.gz [Compressed archives]
 35.493:  2.79%:   70: 20.06%: [no extension]
 34.297:  2.70%:   10:  2.87%: .zip  [Zip archives]
 28.644:  2.25%:   37: 10.60%: .xpi
 10.736:  0.84%:    6:  1.72%: .bin
  8.104:  0.64%:    3:  0.86%: .EXE
  0.318:  0.03%:   32:  9.17%: [not listed: 7 extensions]
(Go To: Top: General Summary: Monthly Report: Daily Summary: Hourly Summary: Domain Report: Organisation Report: Status Code Report: File Size Report: File Type Report: Directory Report: Request Report)
This report lists the directories from which files were requested. (The figures for each directory include all of its subdirectories.)

Listing directories with at least 0.01% of the traffic, sorted by the amount of traffic.
 Gbytes: %bytes: reqs:  %reqs: pages: %pages: directory
-------: ------: ----: ------: -----: ------: ---------
  1.059: 85.29%:  303: 86.82%:     0:       : /pub/
  0.178: 14.38%:   14:  4.01%:     0:       : /communicator/
  0.003:  0.32%:    5:  1.43%:     0:       : /calendar/
  0.000:  0.01%:   27:  7.74%:     0:       : [not listed: 2 directories]
(Go To: Top: General Summary: Monthly Report: Daily Summary: Hourly Summary: Domain Report: Organisation Report: Status Code Report: File Size Report: File Type Report: Directory Report: Request Report)
This report lists the files on the site.

Listing files with at least 20 requests, sorted by the number of requests.
 Mbytes: %bytes: reqs:  %reqs: file
-------: ------: ----: ------: ----
369.939: 29.08%:   59: 16.91%: /pub/netscape7/english/7.0/windows/win32/sea/NSSetupB.exe
175.643: 13.81%:   22:  6.30%: /pub/netscape7/english/7.0/unix/linux22/sea/netscape-i686-pc-linux-gnu-sea.tar.gz
726.602: 57.11%:  268: 76.79%: [not listed: 141 files]
(Go To: Top: General Summary: Monthly Report: Daily Summary: Hourly Summary: Domain Report: Organisation Report: Status Code Report: File Size Report: File Type Report: Directory Report: Request Report)